This tutorial is performed on a Linux Ubuntu 15.04 machine (x64).
Buffer overflow attacks make use of vulnerabilities in the stack. The simplest form of buffer overflow attacks take in malicious user input, put them onto the stack, and affect the local variables / return address / arguments that are stored on the stack. This could lead to a change in the values of the variables, or even change the instructions the program calls! The worst instances of such attacks could lead to attackers getting remote control of your machine over a network. Here’s an example. That could be done through injecting shellcode and replacing return addresses to point to and run the poisionous shellcode. However, that will not be covered in this tutorial. This tutorial will only cover how to replace local variables with your desired input.
If you’re better at learning by looking at code, here’s my Github repository storing the vulnerable code and the attack code!
STEP 1 – Creating a Vulnerable C Application

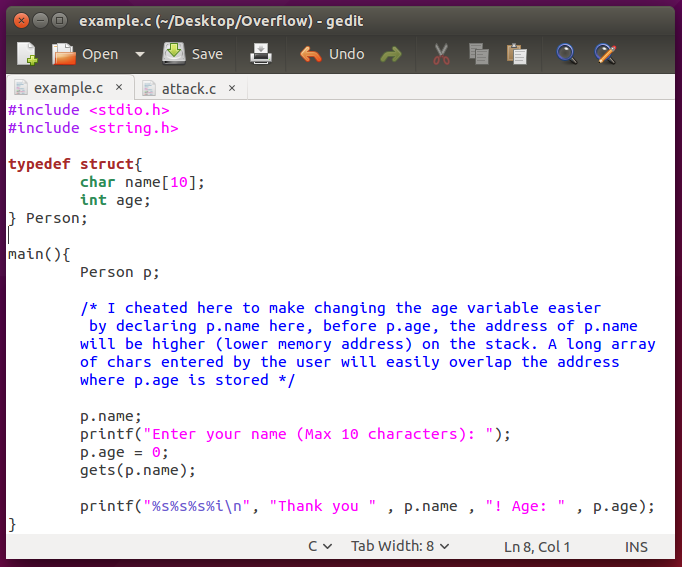
This example program creates a Person struct (complexed data type, storing a list of variables) with attributtes name and age. Name will be decided by user input, while the age is automatically set to 0. The char array “name” is limited to a maximum of 10 characters. Hence, logically speaking, to perform a buffer overflow attack, the user has to input a value that has a length of more than 10 characters.
Compile the program with the following instruction in the command line
gcc -g example.c -o example -fno-stack-protector -z execstack
The compilation instructions do the following:
- -g aids gdb debugging
- -o sets output file
- -fno-stack-protector prevents the compiler from adding canaries to protect the stack (Canaries are checked during runtime to prevent stack smashing)
- -z execstack set marking as requiring executable stack
These instructions help us to make the program easier to attack. The compiler will give a warning for the use of “gets()”, you can ignore it. However, do not use such unsafe operations in your programming outside of this tutorial!
STEP 2 – Observing the stack
GDB is a pre installed debugger in Linux machines. Use it to examine the assembly code of running applications, view the memory stack, and understand how your program runs on a lower (or some say deeper) level!
After compling, do this
gdb example
Here, you have entered the gdb debugger CLI. You may use the following instructions on the command line to help you.
- list – view code
- break xxx – Add a breakpoint to pause your program so that you can view the stack frames, the current stack pointers as well as the assembly instruction that is running. xxx can stand for
- Line number (eg. break 7) –> breaks before line 7 runs
- Assembly instruction (eg. break *0x00000000004005ab) –> this is what an assembly instruction address looks like in a 64-bit machine. breaks before assembly instruction at 0x00000000004005ab runs
- function/method name (eg. break main) –> breaks before main method runs
- r – runs program
- next – runs next line
- nexti – runs next assembly instruction
- disas xxx – Disassemble and view assembly instruction. if only disas is used, the current frame is disassembled. If disas 0x00000000004005ab, assembly instructions of the function/method in which 0x00000000004005ab lies in is shown. *Hint* disas /m shows assembly instructions organized within lines a C code.
- x/nfu xxx– examine stack at location xxx. (eg. x/10xw 0x7fffffffde90) –> this is what the address of a particular stack frame looks like in a 64-bit machine. These are what nfu can stand for (Further explanation here):
- n – number of frames to be displayed, starting in increasing value of addresses. 0x7fffffffde90, followed by 0x7fffffffde94 and so on.
- f – display format, either in hexadecimals (x), decimals (d) and so on.
- u – unit size, which can be in words (four bytes) (w), bytes (8 bits) (b), and so on.
- p/x xxx– print values. Here are some examples p/x 0xbffff789-0xbffff779 will output 0x10 (hexadecimal value), while p/d 0x10 will output 16 (decimal value)
- info xxx – gives information about frames/registers/breakpoints and so on
- info break – Display breakpoints
- info frame – Display current frame values and pointers
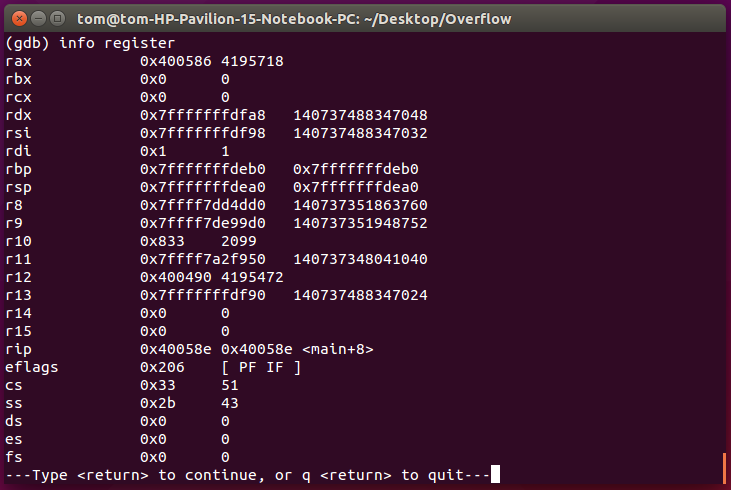
- info register – Display current register values (We will be focusing on rbp (base pointer) and rsp (stack pointer)
- delete xxx – Deletes breakpoints. (eg. delete will delete all breakpoints, delete 2 will delete the second breakpoint)
Let’s go right in to debug!


This means that the memory space the main method uses lies between 0x7fffffffdeb0 and 0x7fffffffdea0. We have to view the contents of the stack frame to know what actually happens, where is the return address, where exactly are the local variables stored. Viewing the stack frames after every instruction will allow you to see what changes each instruction make to the stack frame. This will help you find out where the buffer space is for you to attack, and which part of the stack frame you will be able to insert a value into.


We will use next to reach the part of the program where it asks for an input from the user, and enter an input for the variable name. We shall see where the variable name is stored.

You’re right! “31” is the ASCII value for the decimal number “1”. storage of the name variable seems to go across 15 bytes, from 0x7fffffffdea0 to 0x7fffffffdeae! Now let’s see the age variable printed out. How could it be 6710628? If the name variable staayed within 10 characters, age would still have been 0!
To check the hexadecimal value of 6710628, we did this. Alternatively, you may also use a hexadecimal converter
0x666564.. Where did you see this value? At 0x7fffffffdeac! This means that the age variable is likely to be stored within the 4 bytes here! This, coincidentally, is the 13th character of the user input! Now this allows us to go on to the next step.
STEP 3 – Build an exploit!

‘\x4D’ is the hexadecimal value equivalent of the number 77. Let’s see how you can perform the attack!

Final words
You may now proceed on to alter the code and perform a different exploit, change the name and age as you desire. This is only the start of your many more exploits.
It is important to give credits to my mentors. I’ve learnt the basics of debugging C and buffer overflow attacks on Linux 32-bit machines from Professor Debin Gao in SMU and his Teaching Assistant Lim Anyu. Hopefully you readers will be able to build on this tutorial and do greater things! Do leave a comment if you have any questions! 🙂

Great walk through that shows what a buffer overflow is and why it’s important to guard against them.
LikeLiked by 1 person
Thanks! I’m just starting out these tutorials, glad you liked it!
LikeLike
Hello, it is very nice tutorial.
But, I still don’t understand. If variable “name” is can only store for 10 characters 123456789a (10 bytes) and variable “age” will keep d,e,f,null (4 bytes). So, where b and c is stored ?
I am sorry if my question is ridiculous, I’m still beginner.
I hope I can get some explanation from you. Thank you
LikeLiked by 1 person
Take a look at the screenshot showing the stack frame after user input. Do you spot where b and c are (Hint: 62,63)?
That’s where b and c is. The pointer for the age variable however, does not point to where b and c is. They point to the later part of the stack frame. What I’d urge you to try is to edit my code and set a different amount of characters for the variable “name”. For example, char name[12]
Examine the stack frame again, and you’ll see what happens 🙂
LikeLike
Spot on with this write-up, I really believe this amazing site needs far more attention. I’ll probably be returning to see more, thanks for the information!
LikeLike